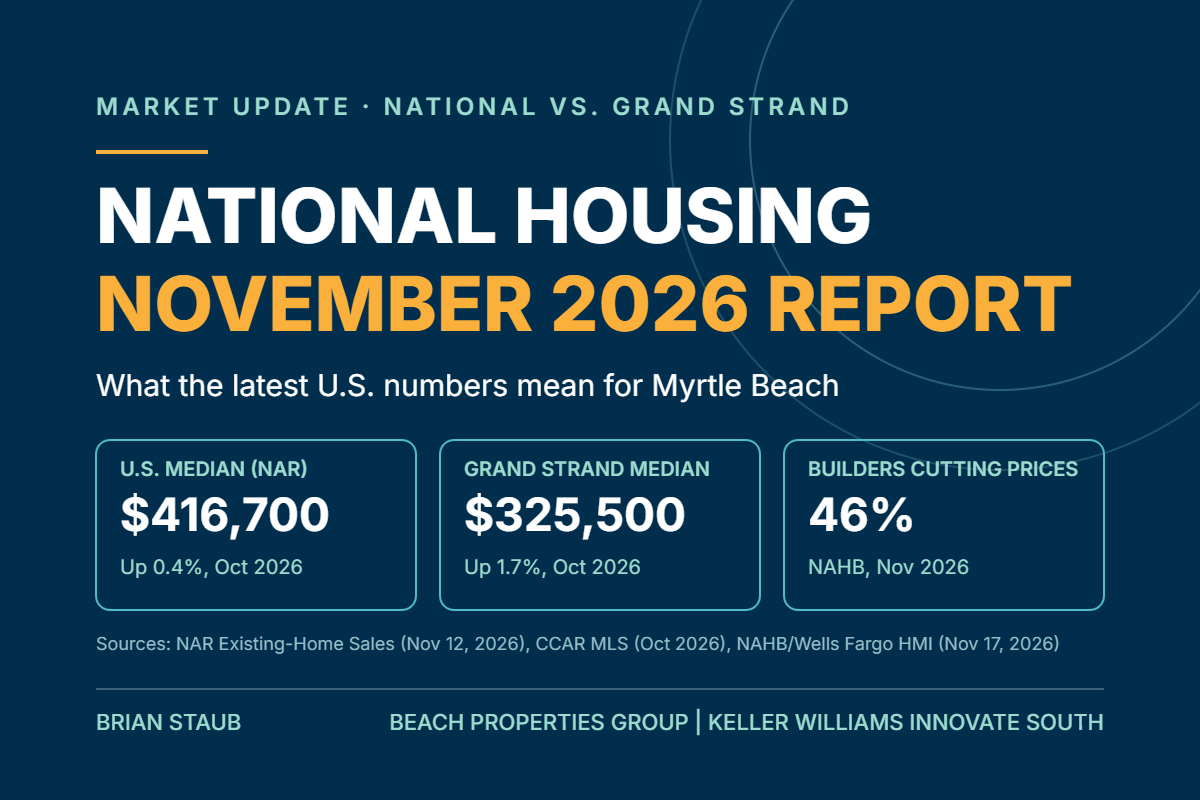
National Housing Market Report, November 2026: What It Means for Myrtle Beach
When national headlines say home sales hit a 16-year low, does that mean the same thing is happening in Myrtle Beach? Not exactly. The national and Grand Strand numbers moved in the same direction in October 2026, but by different amounts, and the gap between national and local prices is wide.
Here is what the national data released through November 17, 2026 shows, and how it lines up with the October numbers from our local MLS.
Quick Answer
The National Association of REALTORS® (NAR) reported existing-home sales at a 3.75 million annual rate in October 2026, down 8.8% from a year earlier, with a national median price of $416,700, up 0.4%. On the Grand Strand, the CCAR MLS median was $325,500, up 1.7%, and closed sales were down 9.1%. Builder confidence fell to 25 in November, and the Mortgage News Daily 30-year fixed average was 7.50% on November 17.
I have worked both sides of real estate deals since 2006, and I owned a contracting company that built new homes for more than 17 years, so I pay attention to both the resale numbers and the builder numbers below.
What Did National Existing-Home Sales Look Like in October 2026?
From NAR's October 2026 Existing-Home Sales report, released November 12, 2026:
Existing-Home Sales: 3.75 million annual rate (October 2026), down 5.5% from September and down 8.8% from October 2025
Median Existing-Home Price: $416,700 (October 2026) vs. $414,900 (October 2025), up 0.4%
Inventory: 1.59 million homes (October 2026), up 1.3% from September and up 4.6% from a year ago
Months Supply: 5.1 (October 2026) vs. 4.7 (September 2026) vs. 4.4 (October 2025)
Median Time on Market: 35 days (October 2026) vs. 33 (September 2026) vs. 34 (October 2025)
First-Time Buyers: 29% of sales (October 2026) vs. 32% (October 2025)
Cash Sales: 29% (October 2026)
Individual Investors and Second-Home Buyers: 20% (October 2026) vs. 16% (October 2025)
Distressed Sales: 2% (October 2026)
NAR's chief economist, Lawrence Yun, said sales fell to their lowest level since August 2010. NAR also reported that the median price has now risen year over year for 40 months in a row.
By type, single family existing-home sales were 3.41 million (median $421,900, up 0.4%), and condo and co-op sales were 340,000 (median $365,100, up 0.3%).
How Did the South Compare?
The South, the NAR region that includes South Carolina:
South Existing-Home Sales: 1.73 million annual rate (October 2026), down 6.5% from September and down 8% from October 2025
South Median Price: $360,900 (October 2026), down 0.4% from a year ago
The South was one of two regions where the median price did not rise year over year in October (the West was unchanged).
What Is Happening With New Homes Nationally?
The latest Census Bureau and HUD new home sales report covers September 2026 (released October 27, 2026). The October report is due November 25.
New Single-Family Home Sales: 676,000 annual rate (September 2026), down 0.6% from August and down 5.3% from September 2025
Median New Home Price: $400,400 (September 2026), up 3.9% from August and down 3.9% from September 2025
Average New Home Price: $472,800 (September 2026)
New Homes for Sale: 476,000 (September 2026), an 8.4-month supply
The Census margins of error on these changes are wide (plus or minus 13.8% on the monthly sales change and 12.5% on the yearly change), so the sales changes are not a clear signal. These figures are preliminary and get revised.
Are Builders Starting More Homes?
Census New Residential Construction, September 2026 (released October 20, 2026). The October report is due November 18.
Building Permits: 1,400,000 annual rate, down 0.2% from August and down 3.0% from September 2025
Housing Starts: 1,221,000, down 5.2% from August and down 7.4% from September 2025
Single-Family Starts: 859,000, down 4.6% from August
Completions: 1,192,000, up 2.2% from August and down 14.0% from September 2025
Like the sales data, these are preliminary estimates, and the monthly changes in starts fall within the Census margin of error.
How Do Builders Feel About the Market?
The NAHB/Wells Fargo Housing Market Index, released November 17, 2026:
Builder Confidence: 25 (November 2026), down 4 points from October. Readings below 50 mean more builders see conditions as poor than good.
Current Sales Conditions: 28, down 6 points
Sales Expectations for the Next Six Months: 30, down 2 points
Buyer Traffic: 16, down 2 points
Builders Cutting Prices: 46%, the highest share in the post-Covid period according to NAHB
Average Price Cut: 6%
Builders Using Sales Incentives: 68%
That lines up with what buyers see in new construction communities: price cuts and incentives are common nationally. On the Grand Strand, new construction homes in the MLS sold for a median 100.0% of their last list price in October, but the MLS does not show incentives, so I cannot confirm how many local buyers received them. If you are weighing new against resale, my posts on builder incentives in Myrtle Beach and the new construction homes guide explain how it works here.
How Does the Grand Strand Compare With the National Numbers?
National figures are from NAR (October 2026) and Census (September 2026). Grand Strand figures are from the CCAR MLS (October 2026, pulled November 17, 2026).
Median Sale Price: $325,500 (Grand Strand, all types) vs. $416,700 (national existing homes)
Change From a Year Ago: up 1.7% (Grand Strand) vs. up 0.4% (national)
Single Family Median: $375,000 (Grand Strand, unchanged from a year ago) vs. $421,900 (national, up 0.4%)
Sales Change From a Year Ago: down 9.1% (Grand Strand closed sales) vs. down 8.8% (national existing-home sales)
Months Supply: 5.3 (Grand Strand) vs. 5.1 (national)
New Construction Median: $351,260 (Grand Strand MLS, October 2026) vs. $400,400 (Census, September 2026)
A few cautions so the comparison is fair:
The Grand Strand all-types median includes a lot of condos. Townhouses and condos had a $230,750 median here in October.
NAR's national figures are seasonally adjusted annual rates. The local figures are actual monthly counts. Compare the direction, not the size.
NAR and CCAR measure months of supply and time on market differently, and NAR's 35-day figure comes from its REALTORS® Confidence Index survey, so I am not comparing it with our local 98-day median.
MLS new construction leaves out builder sales that are never entered in the MLS.
The full local breakdown is in my Myrtle Beach housing market report for November 2026.
What Are Mortgage Rates Doing?
Mortgage News Daily rate index (daily averages, not quotes):
30-Year Fixed: 7.50% (November 17, 2026) vs. 7.27% (October 30, 2026)
15-Year Fixed: 7.04% (November 17, 2026) vs. 6.92% (October 30, 2026)
30-Year FHA: 7.07% (November 17, 2026) vs. 6.90% (October 30, 2026)
30-Year VA: 7.08% (November 17, 2026) vs. 6.91% (October 30, 2026)
Mortgage News Daily shows the 30-year fixed up 1.12 points from a year ago, which works out to about 6.38% (7.50 minus 1.12). NAR's Housing Affordability Index was 100.7 in October, down from 107.3 a year earlier. Here is how mortgage interest rates work when you buy in Myrtle Beach, and you can browse homes for sale in Myrtle Beach any time.
Does the National Housing Market Affect Myrtle Beach Home Prices?
Mortgage rates are set nationally, so they reach every market, including ours. Prices, though, come down to local supply and demand. In October, the Grand Strand median rose more than the national median (1.7% vs. 0.4%), while local closings fell about as much as national sales (9.1% vs. 8.8%).
Why Is the National Median Price So Much Higher Than Myrtle Beach's?
The national median of $416,700 covers existing homes across the country, while the Grand Strand median of $325,500 includes a large share of condos. Comparing single family to single family narrows the gap: $375,000 here vs. $421,900 nationally, a difference of $46,900 instead of $91,200. The two numbers still measure different markets.
Where Do These National Numbers Come From?
Existing-home sales come from NAR. New home sales and construction come from the U.S. Census Bureau and HUD, which are government sources. Builder confidence comes from NAHB, an industry group. Government figures are preliminary and often revised.
When Is the Next National Data Coming Out?
November 18, 2026: Census new residential construction for October, and NAR pending home sales for October
November 25, 2026: Census new home sales for October
December 9, 2026: NAR existing-home sales for November
December 17, 2026: Census new residential construction for November
Final Thoughts
Nationally, October brought the slowest existing-home sales pace since 2010, small price gains, more inventory, and builders leaning harder on price cuts and incentives. The Grand Strand followed the same direction on sales, with a slightly stronger price change. Rates rose again in the first half of November.
If you want to talk about what any of this means for your plans to buy or sell here, you can book a quick Zoom call or call or text me at (843) 385-6630.
Sources: NAR Existing-Home Sales, October 2026, released November 12, 2026. Census and HUD New Residential Sales, September 2026, released October 27, 2026. Census and HUD New Residential Construction, September 2026, released October 20, 2026. NAHB/Wells Fargo Housing Market Index, released November 17, 2026. Release dates: Census 2026 calendar and NAR 2026 release schedule. Local: Coastal Carolinas Association of REALTORS® MLS via ShowingTime InfoSparks, pulled November 17, 2026. Rates: Mortgage News Daily, checked November 17, 2026.
The information in this article is for general educational purposes and is not legal, tax, or financial advice. Market conditions change, so please confirm details with the appropriate professional before making decisions. Beach Properties Group, Keller Williams Innovate South, 601 21st Ave N, Myrtle Beach, SC 29577, (843) 443-9400. Each office is independently owned and operated. Equal Housing Opportunity.
Brian Staub is a real estate agent in Myrtle Beach, South Carolina helping homeowners sell with clarity and confidence.
Brian Staub
Beach Properties Group Keller Williams
601 21st Ave N, Myrtle Beach, SC 29577
(843) 385-6630
https://beachpropertiesgroup.com/
