Myrtle Beach Housing Market Report: November 2026
How did the Myrtle Beach housing market do in October 2026? Prices held close to where they were a year ago, fewer homes closed, and more buyers went under contract than in September. Mortgage rates are the bigger story heading into November. The Mortgage News Daily 30-year fixed average was 7.50% on November 17, up from 7.27% on October 30.
Below are the October numbers from the Coastal Carolinas Association of REALTORS® (CCAR) MLS, pulled on November 17, 2026, for the whole Grand Strand MLS and for Myrtle Beach. Every number has a comparison to September 2026 and to October 2025, so you can see the direction for yourself.
Quick Answer
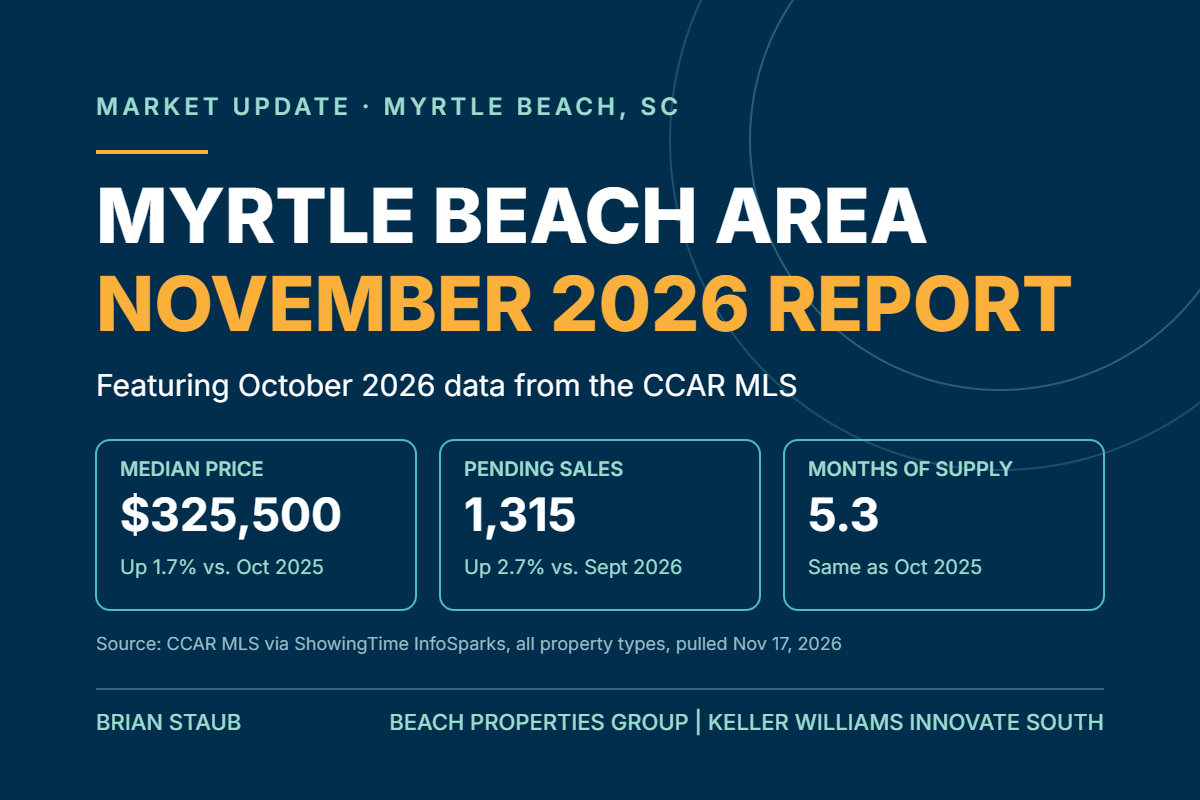
The median sales price across the CCAR MLS was $325,500 in October 2026, up 1.7% from October 2025. Closed sales fell 9.1% from a year ago to 1,382, while pending sales rose 2.7% from September to 1,315. Supply held at 5.3 months, and homes sold for a median 97.8% of their last list price after a median 98 days on market.
I have been licensed since 2006 and spent more than 17 years running a contracting company that did new builds and fix and flips, so I watch both the resale numbers and the new construction numbers closely. This report sticks to what the MLS data shows.
What Happened to Home Prices in Myrtle Beach in October 2026?
Here is what the CCAR MLS shows for all property types:
Median Sales Price, CCAR MLS: $325,500 (October 2026) vs. $332,891 (September 2026) vs. $320,000 (October 2025)
Average Sales Price, CCAR MLS: $394,918 (October 2026) vs. $408,928 (September 2026) vs. $379,953 (October 2025)
Median Sales Price, Myrtle Beach: $305,000 (October 2026) vs. $321,250 (September 2026) vs. $305,000 (October 2025)
Average Sales Price, Myrtle Beach: $394,484 (October 2026) vs. $395,741 (September 2026) vs. $365,190 (October 2025)
How the changes were figured: ($325,500 minus $320,000) divided by $320,000 = up 1.7% year over year for the MLS median, and ($325,500 minus $332,891) divided by $332,891 = down 2.2% from September. The Myrtle Beach median was unchanged from October 2025 and down 5.1% from September.
One month of medians can move around because the mix of homes that closed changes from month to month. The year over year comparison is the steadier read.
How Many Homes Sold, and Are Buyers Still Writing Contracts?
Closed Sales, CCAR MLS: 1,382 (October 2026) vs. 1,492 (September 2026) vs. 1,520 (October 2025)
Pending Sales, CCAR MLS: 1,315 (October 2026) vs. 1,280 (September 2026) vs. 1,445 (October 2025)
Closed Sales, Myrtle Beach: 458 (October 2026) vs. 466 (September 2026) vs. 538 (October 2025)
Pending Sales, Myrtle Beach: 437 (October 2026) vs. 422 (September 2026) vs. 501 (October 2025)
Closed sales across the MLS were down 7.4% from September and 9.1% from October 2025. Pending sales, which count homes that went under contract, rose 2.7% from September but were 9.0% below last October. In Myrtle Beach, pending sales rose 3.6% from September and were down 12.8% from a year ago.
If you are not sure what "pending" means for your sale, I explain it in what pending means when you sell in Myrtle Beach.
How Long Are Homes Taking to Sell?
Median Days on Market, CCAR MLS: 98 (October 2026) vs. 106 (September 2026) vs. 103 (October 2025)
Median Days on Market, Myrtle Beach: 86 (October 2026) vs. 110 (September 2026) vs. 92 (October 2025)
Homes that sold in October moved a little faster than in September and a little faster than a year ago. Here is what days on market means and how it is counted.
How Much Are Sellers Getting Compared With List Price?
Median Percent of Last List Price Received, CCAR MLS: 97.8% (October 2026) vs. 97.7% (September 2026) vs. 97.7% (October 2025)
Median Percent of Last List Price Received, Myrtle Beach: 96.9% (October 2026) vs. 97.3% (September 2026) vs. 97.3% (October 2025)
This measures the sale price against the last list price, after any price reductions. On a $400,000 last list price, 97.8% works out to $391,200.
How Much Inventory Is on the Market?
Homes for Sale, CCAR MLS: 7,517 (October 2026) vs. 7,682 (September 2026) vs. 7,537 (October 2025)
Months Supply of Inventory, CCAR MLS: 5.3 (October 2026) vs. 5.4 (September 2026) vs. 5.3 (October 2025)
New Listings, CCAR MLS: 1,942 (October 2026) vs. 2,007 (September 2026) vs. 2,091 (October 2025)
Homes for Sale, Myrtle Beach: 3,022 (October 2026) vs. 3,054 (September 2026) vs. 2,998 (October 2025)
Months Supply of Inventory, Myrtle Beach: 6.4 (October 2026) vs. 6.4 (September 2026) vs. 5.9 (October 2025)
Months of supply estimates how long the current inventory would last at the current pace of sales. Across the MLS it was the same as a year ago. In Myrtle Beach it rose from 5.9 to 6.4 months, because sales fell more than inventory did. New listings were down 7.1% from last October across the MLS, so fewer sellers came to market.
You can browse homes for sale across the Grand Strand to see what is listed today.
Single Family Homes vs. Townhouses and Condos
The all-property median is pulled down by condo sales, so it helps to look at each type on its own. CCAR MLS, October 2026:
Median Sales Price: $375,000 (single family) vs. $230,750 (townhouse and condo)
Closed Sales: 878 (single family) vs. 433 (townhouse and condo)
Months Supply: 4.1 (single family) vs. 7.5 (townhouse and condo)
Median Percent of Last List Price: 98.2% (single family) vs. 96.7% (townhouse and condo)
Median Days on Market: 97 (single family) vs. 104 (townhouse and condo)
Single family median: $375,000 in October 2026 vs. $379,280 in September 2026 vs. $375,000 in October 2025. Townhouse and condo median: $230,750 vs. $230,000 vs. $235,000. In this MLS filter, townhouses and condos are one category.
Townhouse and condo closings rose 13.4% from September (433 vs. 382), while single family closings fell 15.4% (878 vs. 1,038). Townhouse and condo supply is still almost twice the single family supply, 7.5 months vs. 4.1 months.
In Myrtle Beach itself, the single family median was $472,500 on 234 sales (vs. $410,000 on 291 sales in October 2025), and the townhouse and condo median was $207,000 on 201 sales (vs. $198,500 on 224 sales). The single family jump is large for one month, so I would not read it as a trend until more months confirm it.
What Did Each Price Range Look Like?
CCAR MLS, all property types, October 2026 (vs. October 2025):
Under $400,000: 914 closed sales (vs. 1,044), median $265,000 (vs. $269,995), 5.4 months of supply (vs. 5.4), 97.5% of last list price
$400,000 to $749,999: 369 closed sales (vs. 392), median $506,000 (vs. $519,935), 4.7 months of supply (vs. 4.7), 98.5% of last list price
$750,000 to $1,499,999: 81 closed sales (vs. 66), median $920,000 (vs. $856,000), 6.8 months of supply (vs. 6.7), 97.7% of last list price
$1,500,000 and above: 19 closed sales (vs. 18), median $1,805,000 (vs. $1,857,500), 7.9 months of supply (vs. 8.8), 96.1% of last list price
The $400,000 to $749,999 range had the tightest supply and the highest share of list price. The $750,000 to $1,499,999 range was the only band with more closings than a year ago (up 22.7%). The $1,500,000 and above range closed only 19 homes, so its median can swing a lot from month to month. New listings at $1,500,000 and above rose to 50 from 38 in September and 35 in October 2025.
What About New Construction?
CCAR MLS, new construction, all property types:
Closed Sales: 383 (October 2026) vs. 539 (September 2026) vs. 480 (October 2025)
Median Sales Price: $351,260 (October 2026) vs. $345,000 (September 2026) vs. $350,022 (October 2025)
Pending Sales: 407 (October 2026) vs. 374 (September 2026) vs. 489 (October 2025)
Homes for Sale: 1,507 (October 2026) vs. 1,571 (September 2026) vs. 1,661 (October 2025)
Months Supply: 3.2 (October 2026) vs. 3.3 (September 2026) vs. 3.2 (October 2025)
Median Percent of Last List Price: 100.0% (October 2026) vs. 99.5% (September 2026) vs. 100.0% (October 2025)
New construction closings were down 28.9% from September and 20.2% from a year ago, while the median price was nearly flat year over year (up 0.4%). One caution: builders do not list every home in the MLS, and some sell directly from a community sales office, so these numbers describe MLS activity only, not all building in the area. The MLS also does not show which sales included builder incentives, so I cannot tell from this data how many October buyers received them. My new construction homes guide walks through how buying new works here.
What Are Mortgage Rates Doing?
Mortgage News Daily rate index (daily averages, not quotes):
30-Year Fixed: 7.50% (November 17, 2026) vs. 7.27% (October 30, 2026)
15-Year Fixed: 7.04% (November 17, 2026) vs. 6.92% (October 30, 2026)
30-Year FHA: 7.07% (November 17, 2026) vs. 6.90% (October 30, 2026)
30-Year VA: 7.08% (November 17, 2026) vs. 6.91% (October 30, 2026)
Mortgage News Daily shows the 30-year fixed up 1.12 points from a year ago, which works out to about 6.38% in November 2025 (7.50 minus 1.12). The index assumes a top-tier borrower, so your own quote can differ. For a real number, talk with a lender. Here is how mortgage interest rates work when you buy in Myrtle Beach, and for the national picture, see my national housing market report for November 2026.
Is Now a Good Time to Sell My Myrtle Beach Home?
The October numbers show prices close to last year, homes selling slightly faster than in September, and sellers receiving a median 97.8% of the last list price. They also show fewer closings than a year ago, and rates were higher in mid-November than at the end of October. Whether that adds up to a good time depends on your home, your price range and your plans. Single family homes had 4.1 months of supply in October, while townhouses and condos had 7.5, so the same market can feel very different depending on what you own. I wrote more about this in is 2026 a good time to sell in Myrtle Beach.
Why Is the Myrtle Beach Median Different From the Grand Strand Median?
The Myrtle Beach figure covers only homes in the Myrtle Beach city area of the MLS, where townhouses and condos made up 201 of 458 closings in October. More condos in the mix usually means a lower median. That is why the Myrtle Beach median ($305,000) sat below the MLS-wide median ($325,500), even though the Myrtle Beach single family median ($472,500) was higher than the MLS-wide single family median ($375,000).
Are Home Prices Falling in Myrtle Beach?
Not on a year over year basis in October. The MLS-wide median was up 1.7% from October 2025, and the Myrtle Beach median was unchanged. The MLS-wide median did dip 2.2% from September, and the under $400,000 and $400,000 to $749,999 ranges were both a little lower than a year ago (down 1.9% and 2.7%). It depends on the segment.
Where Can I Find the Numbers for My Neighborhood?
Citywide numbers can hide what is happening on your street. When I meet with a seller, I put together a pricing range from comparable sales near the home. If you want a quick starting point, you can get an instant home value estimate, and I explain how a comparative market analysis works for sellers.
Final Thoughts
October 2026 was a steady month for prices and a slower month for closings, with buyers still going under contract and rates rising after the month ended. The details change a lot by property type and price range, so the headline median only tells part of the story.
If you would like to see what these numbers mean for your home, I am happy to talk it through. You can book a quick Zoom call, or call or text me at (843) 385-6630.
Sources: Coastal Carolinas Association of REALTORS® MLS via ShowingTime InfoSparks, data pulled November 17, 2026. MLS figures can be revised as late sales are entered. Mortgage rates: Mortgage News Daily rate index, checked November 17, 2026.
The information in this article is for general educational purposes and is not legal, tax, or financial advice. Market conditions change, so please confirm details with the appropriate professional before making decisions. Beach Properties Group, Keller Williams Innovate South, 601 21st Ave N, Myrtle Beach, SC 29577, (843) 443-9400. Each office is independently owned and operated. Equal Housing Opportunity.
Brian Staub is a real estate agent in Myrtle Beach, South Carolina helping homeowners sell with clarity and confidence.
Brian Staub
Beach Properties Group Keller Williams
601 21st Ave N, Myrtle Beach, SC 29577
(843) 385-6630
https://beachpropertiesgroup.com/
